
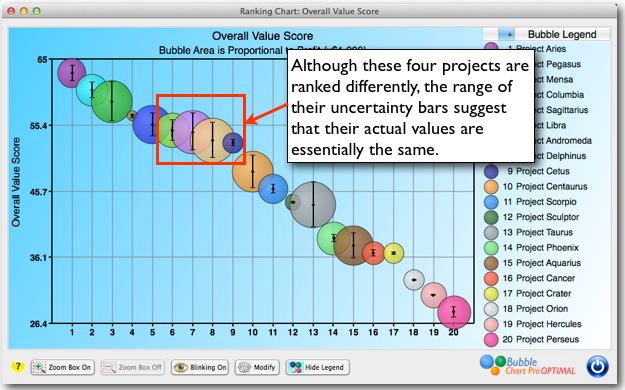
Figure 1: A Project Ranking Chart displaying Uncertainty Bars.
You know that making project portfolio decisions requires making predictions about the future. Predictions about timing, markets, costs, ROI, etc.
And these predictions usually involve a single value, percentage, or date.
And most of the time, they’re wrong.
But, Bubble Chart Pro™ OPTIMAL can help you and your project portfolio management team make much better predications and much better decisions around those predictions.
Let’s say your discussing the potential ROI of a project in your Project Portfolio Management Team. Mary in Finance thinks it’s 20, Jim in Marketing thinks it is 30, and Frank in Operations thinks it is 27. Now you could take the average of their predictions, and use that single number, but that number is still probably wrong.
In Bubble Chart Pro™ OPTIMAL, you can enter all three values: a high value, a low value, and an in-between (or most-likely) value, so instead of using one value to make your decision, you can use a range of values that reflect real-world uncertainty and risk. This lets you capture the estimates of more than one person.
And, as you can see if Figure 1 (above), the length and intersection of the uncertainty (risk) bars show you which projects are essentially identical in value when you account for the uncertainty in the valuation metrics.
(To make it really easy, you can also assign default uncertainty and risk around your metrics that are calculated for you automatically.)
You can also see the uncertainty in your project portfolio bubble charts, which makes comparing project risk really easy and interesting (Figure 2). Plus, you can turn uncertainty and risk tracking on-and-off in the Portfolio Preferences form.