Asking “What If?”: Bubble Chart Pro V. 6 (Preview 3)
Posted on Feb 5, 2015 by
George F Huhn

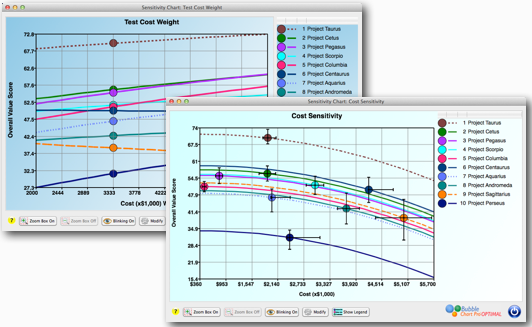

Project Portfolio Sensitivity Analysis Chart for the Attribute “Cost.” Note how the overall value score (Y-Axis) trends down as cost goes up.
Let’s look at testing the sensitivity of a Cost attribute. The goal of attribute sensitivity test ing is to model what happens when one attribute changes while all the other attributes are held constant. The Sensitivity Chart for the Cost attribute above shows that as the costs go up, the overall value score of each project goes down. You can use this chart to see what happens when an individual project’s costs change because it may become more or less valuable than other projects.
With the new risk bars that we’re introducing in Bubble Chart Pro Version 6, you will be able to see the uncertainty in each project and how it compares to other projects in your project portfolio as shown in the chart below. You can toggle the display of these bars on and off in the chart preference form.
Project Portfolio Weight Sensitivity chart with labled bubbles and hidden legend.
I expect we’ll be releasing Version 6 in the next few months, so anyone who purchases a Version 5 license today will be eligible for a free upgrade to Version 6. Note that some of the new features will only be available in the Bubble Chart Pro PLUS and Bubble Chart Pro OPTIMAL editions. Click here to download your free trial today!
Copyright © 2020 · All Rights Reserved · Data Machines, Inc.