Posted on May 27, 2015 by
George F Huhn
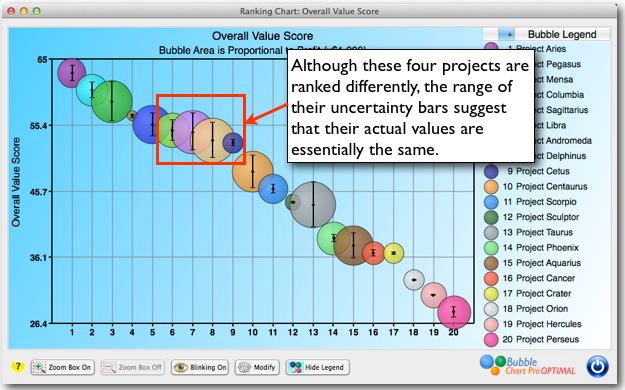
Figure 1: A Project Ranking Chart displaying Uncertainty Bars. You know that making project portfolio decisions requires making predictions about the future. Predictions about timing, markets, costs, ROI, etc. And these predictions usually involve a single value, percentage, or date. And most of the time, they’re wrong. But, Bubble Chart Pro™ OPTIMAL can help you […]
Posted on May 20, 2015 by
George F Huhn
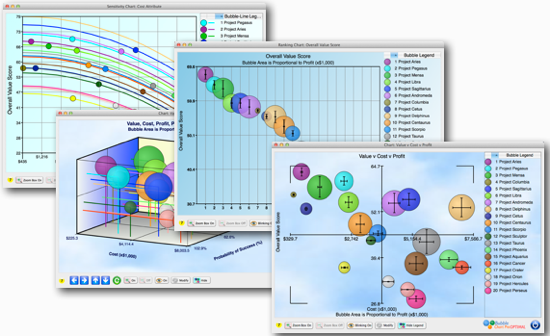
I am pleased to announce that Bubble Chart Pro™ Version 6 has been released, and it is full of new features to help make your business data analysis faster and easier and your presentations and reports more persuasive and insightful. Now in version 6 you can: Instantly see your projects ranked against whatever attribute you […]
Posted on May 11, 2015 by
George F Huhn
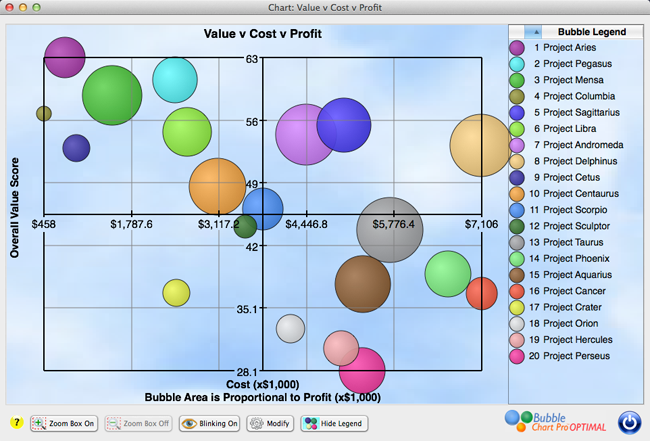
Figure 1: A new project portfolio bubble chart with center axis. In project portfolio management, bubble charts are commonly divided into four quadrants to study the relationships between projects. For example, the chart above (Figure 1) compares projects using SMART Values (Y-axis), Cost (X-axis), and Profitability (Bubble Size). The more desirable projects are the larger […]