Bubble charts are extremely useful in comparing individual projects in multiple dimensions. Today, with the introduction of custom legends in version 5 of Bubble Chart Pro™, we have made it easy to track groups of projects by assigning pattern and/or color-pattern combinations to custom legend items.
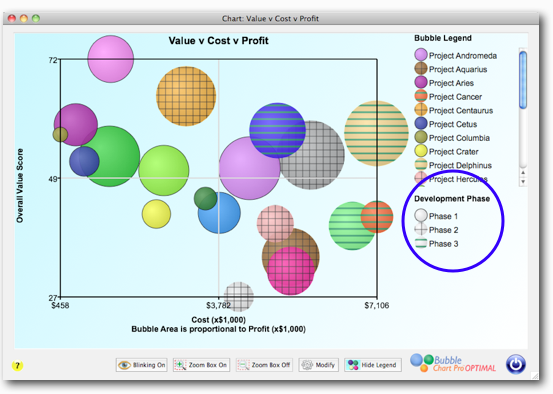
For example, if you wanted to track projects by development phase, you could assign projects to “Phase 1” (early stage), “Phase 2” (middle stage), and “Phase 3” (late stage). Then you set up a custom legend with three items corresponding to each Phase (see example):
- Phase 1: No pattern
- Phase 2: Grey cross-hatch pattern
- Phase 3: Green horizontal lines
After you have assigned each group of projects with the corresponding color-pattern combination, then you can track each group of projects across all of your bubble charts.
You can create and save multiple custom legends and then select which one that you want to use for a particular chart. You can also choose to hide the bubble legend, the custom legend, or both. Showing just the custom legend with bubble labels is also a nice presentation.
In addition, if you check (select) or un-check (deselect) a project in your portfolio, there is a new “Mark Unselected Projects” preference that you can select that will cause unselected projects to be “crossed-out”. This way you can easily track which projects have been selected and which have not.

One comment to Tracking Projects By Using Custom Legends in Bubble Charts