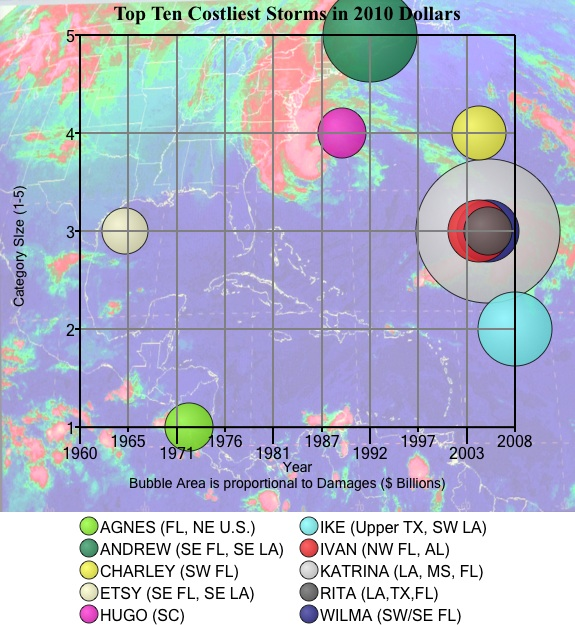
These bubble charts show how you can add a custom background picture or graphic to a Bubble Chart Pro™ bubble chart for a dramatic effect.

These bubble charts show how you can add a custom background picture or graphic to a Bubble Chart Pro™ bubble chart for a dramatic effect.