Project Ranking Charts: Bubble Chart Pro™ V.6 (Preview 2)
Posted on Jan 28, 2015 by
George F Huhn

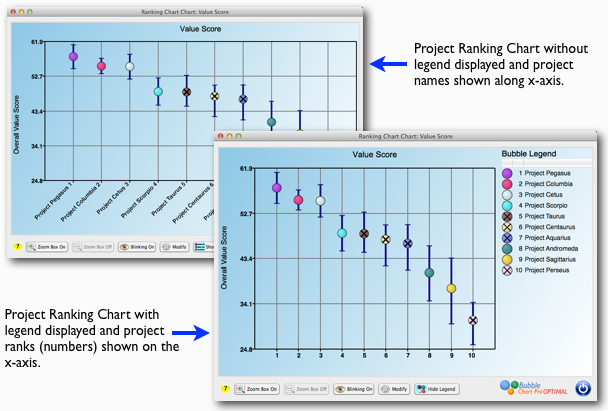
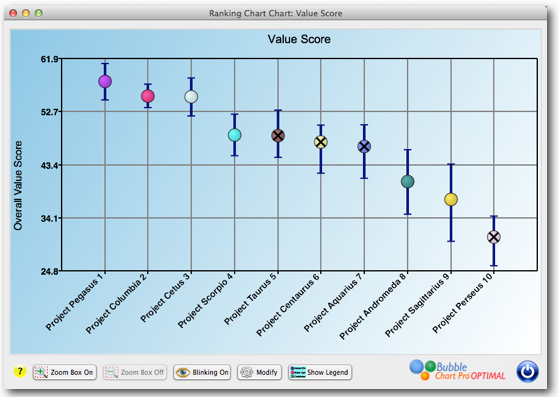
Project portfolio ranked by Value Score with “most-likely,” “best,” and “worst” calculated outcomes.
Like all the bubble charts in Bubble Chart Pro, the Project Ranking charts are highly customizable. Both the risk bars and bubbles can be toggled “On” and “Off” using a check box, and you can set the default color and width of the bars in the Preferences form. Plus, you get all the other Bubble Chart Pro features such as custom backgrounds, custom legends,”blinking” bubbles, interactive charts, etc. For example, in the project portfolio ranking chart shown below, projects are prioritized by “Profit” on the Y-axis, the bubbles and bars are displayed as a single color, and a picture of clouds has been added to the background.
Project Ranking Chart for “Profits” using a single color for both center points and bars and displaying a cloud picture background.
You can enter the uncertainty values for each project individually or set it as a +/-percentage for all the projects and it will be calculated for you automatically (such as all “Cost” “best” and “worst” outcomes could be set at +/-10% of the “most-likely” value).
I expect to be releasing Version 6 in the next few months, so anyone who purchases a Version 5 license today will be eligible for a free upgrade to Version 6. Note that the risk bar display features will only be available in the Bubble Chart Pro OPTIMAL editions. Click here to download your free trial today!
Copyright © 2020 · All Rights Reserved · Data Machines, Inc.