Posted on Oct 31, 2012 by
George F Huhn
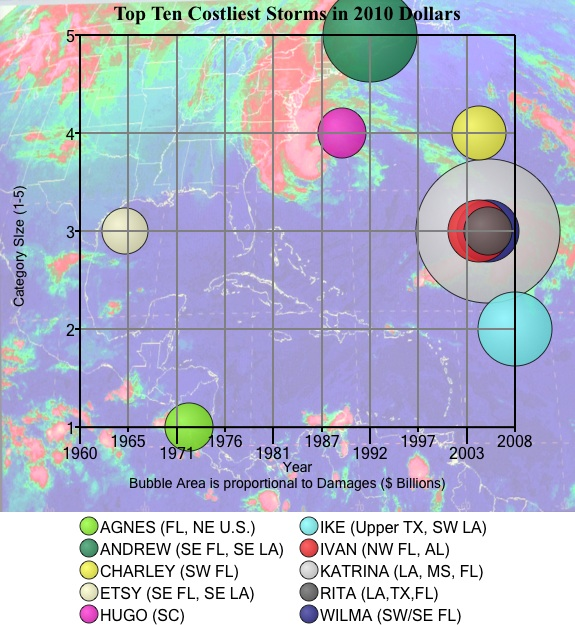
Today’s bubble chart shows the top ten costliest storms in 2010 U.S. dollars. Note how 6 of the 10 costliest storms occurred between 2000 and 2010. However, if you look at it in a different bubble chart after adjusting for population and housing, the picture is different: only 2 of the 10 costliest storms took […]
Posted on Oct 24, 2012 by
George F Huhn
That’s the opinion of Nobel Prize-winning economist Daniel Kahneman. Here’s the full quote from a Strategy+Business Article: “The thing that astonishes me when I talk to businesspeople in the context of decision analysis is that you have an organization that’s making lots of decisions and they’re not keeping track. They’re not trying to learn from […]
Posted on Oct 13, 2012 by
George F Huhn
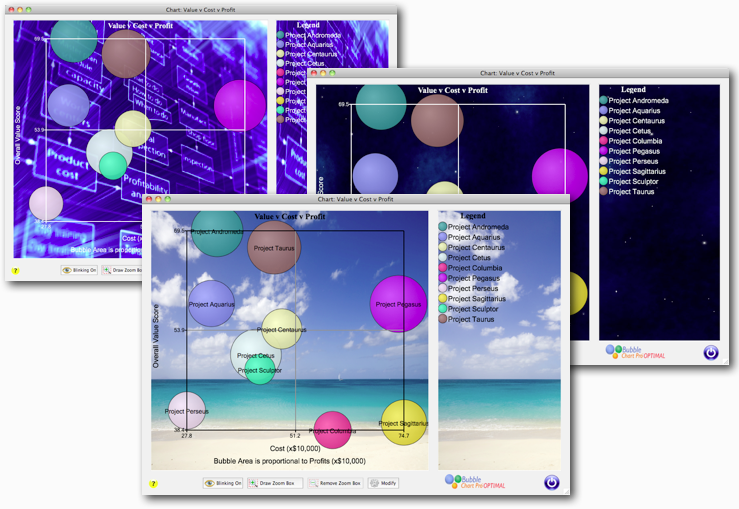
We love new feature suggestions from our users, and we are pleased to introduce the three most requested bubble chart features in Bubble Chart Pro 4. The first most requested feature was the capability to automatically label the bubbles in bubble charts by displaying the project names on top of the bubbles. You can do […]