Coming Soon to Bubble Chart Pro™: 3D Bubble Charts!
Click to enlarge

Coming Soon to Bubble Chart Pro™: 3D Bubble Charts!

Posted on Sep 4, 2013 by George F Huhn
Share

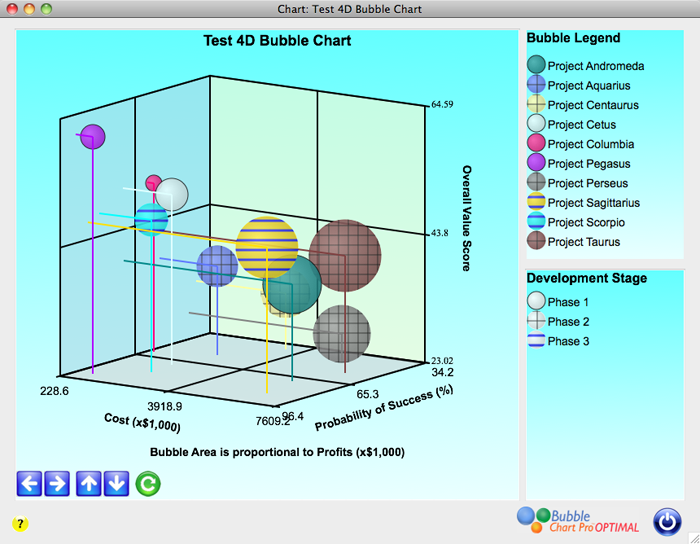
3D bubble charts let you look at 4 dimensions of data in a single chart. Data is represented by the X, Y, and Z-axes and the bubble size. In the prototype chart pictured, the most desirable quadrant is the upper-left-front quadrant – these are the projects with combined lower costs (X-axis), higher success probabilities (Y-axis), […]

What Are Bar Charts Doing in a Bubble Charting Application?
Click to enlarge

What Are Bar Charts Doing in a Bubble Charting Application?

Posted on May 30, 2012 by George F Huhn
Share

We just launched Bubble Chart Pro™ Version 3.0 with some great new additions and features, including a bar chart module in our PLUS and OPTIMAL editions. Why bar charts? Where bubble charts are excellent at displaying the relationships of projects with each other in dimensions of their attributes, such as cost, reward, and risk, our […]

Page 2 of 2« Previous Page12