3D Bubble Charts Are Looking Great!
Click to enlarge

3D Bubble Charts Are Looking Great!

Posted on Sep 14, 2013 by George F Huhn
Share

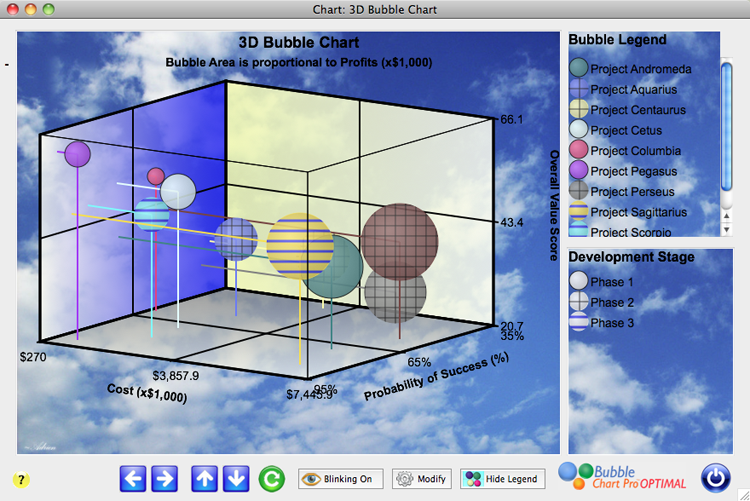
The development of 3D bubble charts for the next version of Bubble Chart Pro™ is almost complete. This is a screenshot of the final 3D bubble chart form. Like our other bubble charts, the 3D bubble charts will be fully customizable including the ability to select the colors for the 3 grids, and to toggle […]

Saying “Goodbye” to “On a Scale of 1 to 10…”
Click to enlarge

Saying “Goodbye” to “On a Scale of 1 to 10…”

Posted on Aug 11, 2013 by George F Huhn
Share

In Version 5.1, we’re introducing “Categories,” a new way to assign values to project attributes in your project portfolios and then plot them in bubble charts. Instead of rating project attributes “on a scale of 1 to 10,” now you can assign categories tied to whatever numerical scale you prefer. For example, in this bubble […]

Page 2 of 2« Previous Page12