The Safest and Most Dangerous States in the United States
Posted on Oct 17, 2013 by
George F Huhn

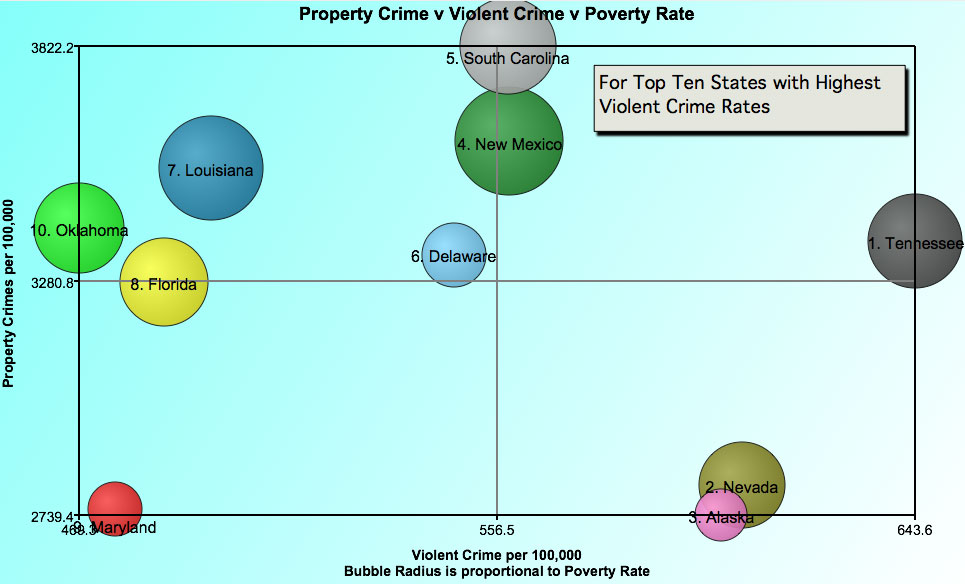
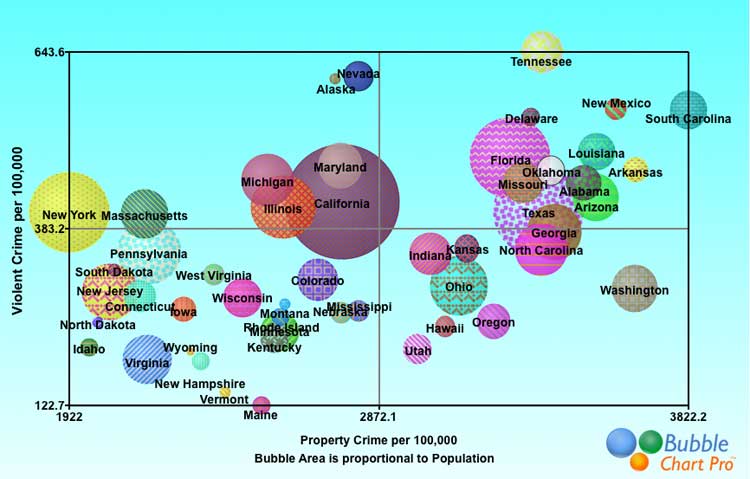
Annual FBI statistics on violent and property crime show the rate of each type of crime per 100,000 residents by state. This bubble chart shows violent crime per 100,000 residents on the y-axis and and property crime per 100,000 residents on the x-axis. Bubble size represents population. By combining the violent and property statistics for […]