Posted on Oct 17, 2013 by
George F Huhn
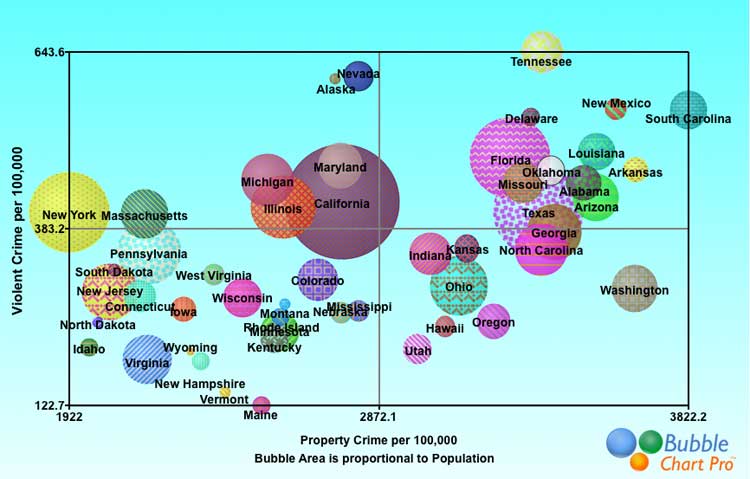
Annual FBI statistics on violent and property crime show the rate of each type of crime per 100,000 residents by state. This bubble chart shows violent crime per 100,000 residents on the y-axis and and property crime per 100,000 residents on the x-axis. Bubble size represents population. By combining the violent and property statistics for […]
Posted on Oct 11, 2013 by
George F Huhn
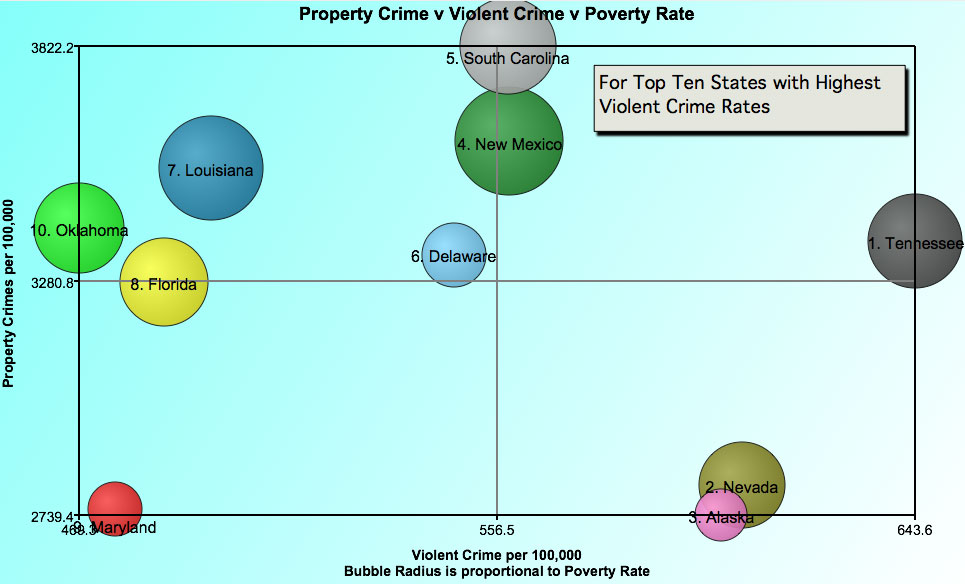
My little home state of Delaware is number 6 on the list of the ten most violent states as per FBI crime statistics published by 24/7. Surprisingly, Tennessee topped the list as the state with the most violent crime per 100,000 people. A bubble chart of the data for these states, with violent crime in […]
Posted on May 10, 2012 by
George F Huhn
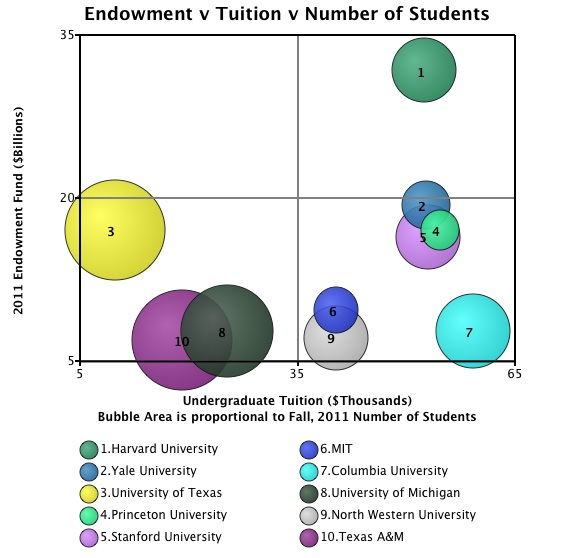
Today’s Bubble Chart is from data published in an article on Yahoo! Colleges are ranked in the legend by size of endowment. “As tuition costs continue to mount at universities across the nation, some colleges are sitting on mountains of cash. And while some of that cash goes to regular campus operations or scholarships for […]
Posted on Mar 26, 2012 by
George F Huhn
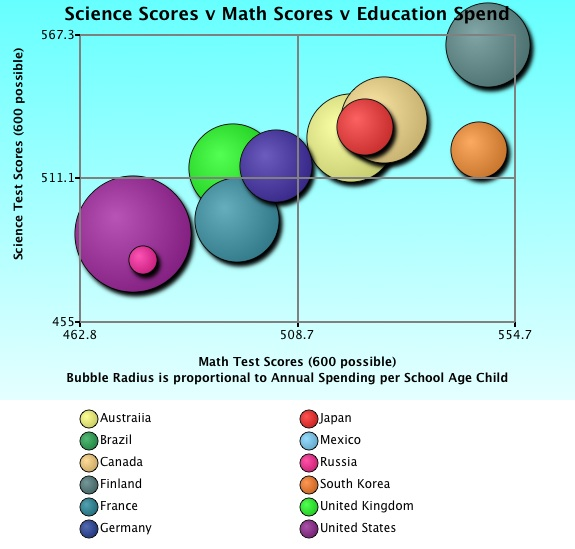
Today’s bubble chart illustrates the relationship between annual education spending and science and math test scores for 12 countries. Here, the x-axis represents math test scores; the y-axis represents science test scores; and the bubble radius represents annual education spending per child. This first chart (above) uses a zoom-box to expand the view of the […]