I am pleased to announce the introduction of 3D bubble charts in Bubble Chart Pro™ version 5.2!
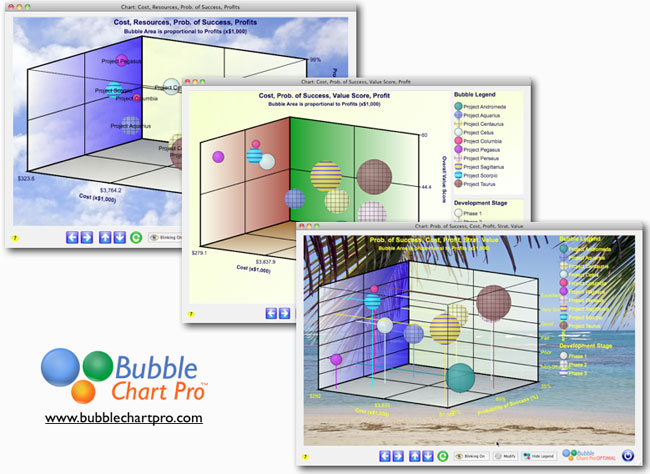
3D bubble charts let you plot 4 data sets in a single chart. In addition to the X and Y axes and bubble size, 3D bubble charts display a third dimension: the Z-axis. 3D bubble charts let you see critical project relationships simultaneously in a single chart. For example, you can see the relationships between cost, reward, risk, and project value in one chart. Plus, you can rotate your 3D bubble charts horizontally and vertically to see your projects from different perspectives.
Click here to see how easy it is to make a 3D bubble chart in Bubble Chart Pro™.
Bubble Chart Pro™ version 5.2 is a free update to all our version 5.x customers. If you’re not already a Bubble Chart Pro™ customer, you can try Bubble Chart Pro™ for free by clicking on the link below to sign-up to download your free demo version.
Click here to get your free demo version now.