Posted on May 30, 2012 by
George F Huhn
We just launched Bubble Chart Pro™ Version 3.0 with some great new additions and features, including a bar chart module in our PLUS and OPTIMAL editions. Why bar charts? Where bubble charts are excellent at displaying the relationships of projects with each other in dimensions of their attributes, such as cost, reward, and risk, our […]
Posted on May 10, 2012 by
George F Huhn
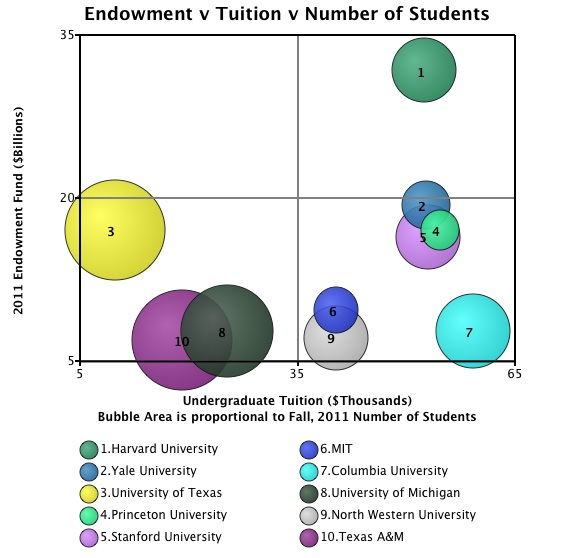
Today’s Bubble Chart is from data published in an article on Yahoo! Colleges are ranked in the legend by size of endowment. “As tuition costs continue to mount at universities across the nation, some colleges are sitting on mountains of cash. And while some of that cash goes to regular campus operations or scholarships for […]
Posted on May 8, 2012 by
George F Huhn
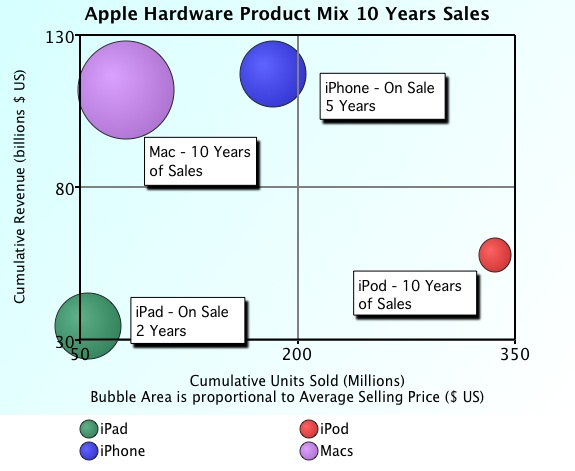
Here’s a bubble chart displaying some cumulative financial and sales data from Apple’s primary hardware product mix over the last ten years. Interesting to note how the revenue of the iPhone has exceeded the Mac and how quickly the iPad’s cumulative revenue is closing in on the iPod, even though the iPad has only 2 […]